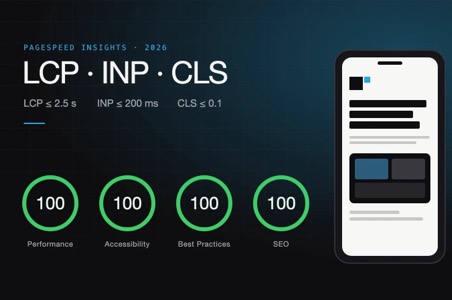
When you hire an agency to build a website, you usually judge the result in a meeting room: a large screen, fast Wi-Fi, the designer walking you through each section. Your visitors see something else. They open the site on a mid-range phone, on mobile data, often while doing something else. PageSpeed Insights is Google's free tool for looking at that second version of your website, and the right time to look is before you approve a design, not after launch.
This article explains what the tool measures, how to read the report, and what to ask the people building your site. We use our own website, izradasajtovasrbija.com, as the example, because we rebuilt it in 2026 and tested it the same way we test client projects.
Two kinds of data in one report
A PageSpeed Insights report combines two different sources, and confusing them is the most common mistake.
- Lab data comes from Lighthouse, which loads the page once in a simulated environment: an emulated phone and a throttled network. Google describes lab data as "useful for debugging issues, as it is collected in a controlled environment."
- Field data comes from the Chrome User Experience Report (CrUX): measurements from real Chrome users over the previous 28 days. According to Google, it is "useful for capturing true, real-world user experience."
Not every website has field data. New sites and sites with modest traffic often see "No Data" in the real-user section. When a single page lacks data, PageSpeed Insights falls back to data for the whole domain, and if that is missing too, you only get the lab test. Think of lab data as the early warning and field data as the verdict.
The score and the Core Web Vitals assessment are not the same thing
The big number at the top, the Performance score from 0 to 100, is calculated from the lab test only. It is a weighted mix of five metrics; in current Lighthouse versions, Total Blocking Time counts for 30%, Largest Contentful Paint and Cumulative Layout Shift for 25% each, and First Contentful Paint and Speed Index for 10% each. A score of 90 or more counts as good. The score also moves between runs, and Google's own documentation suggests treating performance as a distribution of results rather than one number.
The Core Web Vitals assessment is a separate pass or fail verdict based on field data. It looks at the 75th percentile of real visits and passes when all three Core Web Vitals are in the "good" range. That means a page can score 100 in the lab and still fail the assessment, for example when real visitors on older phones run into heavy scripts the lab test never triggered.
LCP, INP and CLS in plain language
- Largest Contentful Paint (LCP) measures how long it takes for the main content, usually the large image or headline at the top, to appear. Good is 2.5 seconds or less.
- Interaction to Next Paint (INP) measures how quickly the page responds when someone taps, clicks or types, across the whole visit. Good is 200 milliseconds or less. INP replaced First Input Delay as a Core Web Vital in 2024, so it is not new, but many older sites were never built with it in mind.
- Cumulative Layout Shift (CLS) measures how much the layout jumps while the page loads: a button that moves just as you tap it, or text pushed down by a late banner. Good is 0.1 or less.
Why the mobile result is the one that counts
Google uses the mobile version of a page for indexing and ranking, a practice it calls mobile-first indexing. The mobile test in PageSpeed Insights also uses an emulated mid-range phone and a slow network, which is much closer to many real visits than an office laptop.
Our own example: izradasajtovasrbija.com
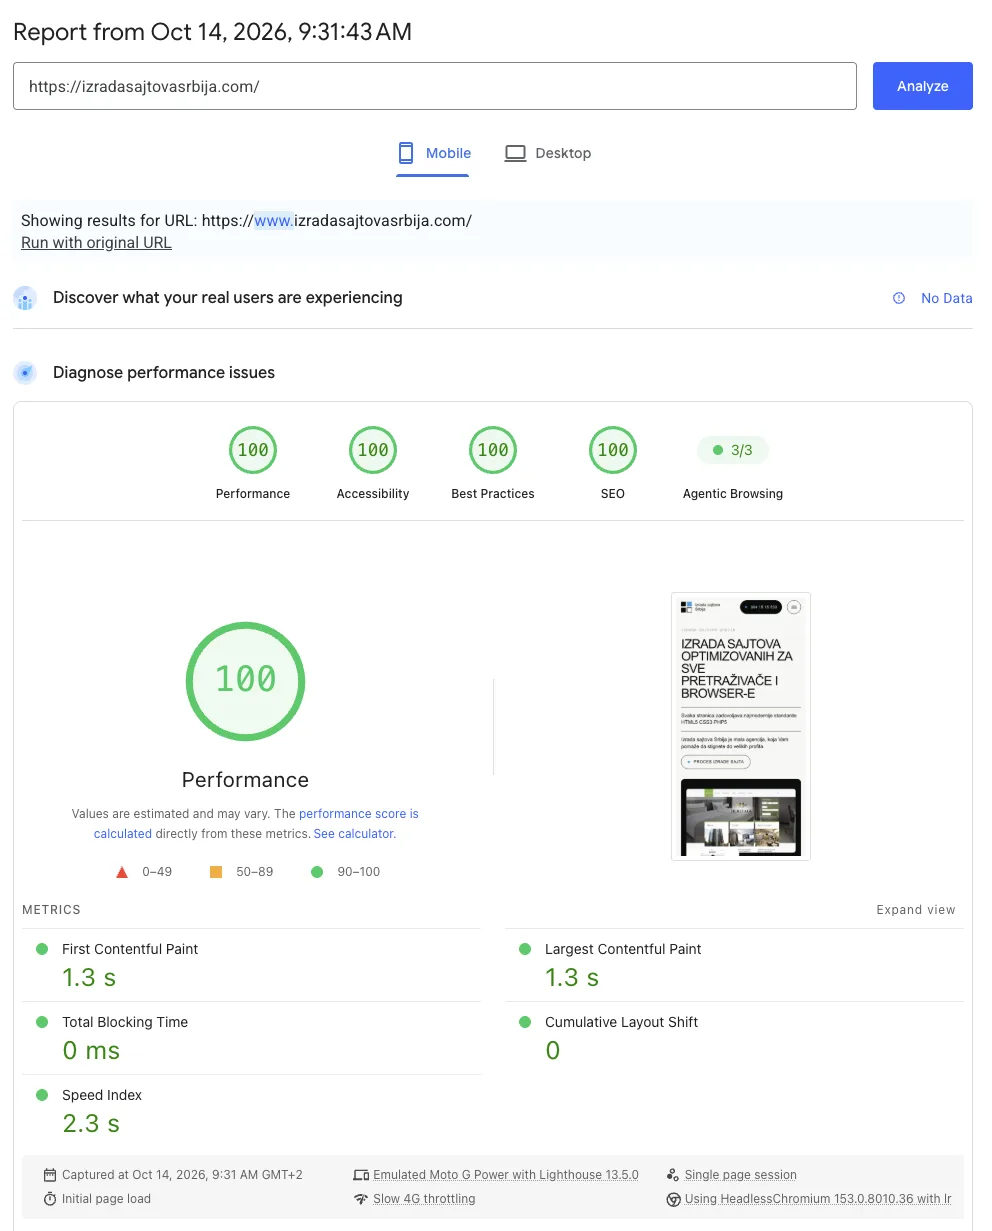
On 14 October 2026 the redesigned homepage scored 100 in Performance, Accessibility, Best Practices and SEO on mobile. First Contentful Paint and Largest Contentful Paint were 1.3 seconds, Total Blocking Time was 0 ms, layout shift was 0 and Speed Index was 2.3 seconds.
Note the "No Data" at the top of the screenshot. The redesign was too recent for CrUX to have enough real-user data, so this result is lab data only. It tells us the build is sound; the field data will tell us whether real visitors agree.
Once CrUX has collected enough real visits, we will add the Core Web Vitals field results here, so you can see how closely the lab and reality match.
What made the difference was a series of ordinary decisions taken early: no page builder, the main heading as text instead of an image, system fonts instead of downloaded web fonts, the CSS delivered with the page, width and height set on every image, images below the fold loaded only when needed, and animations done in CSS rather than heavy scripts. Third-party scripts such as live chat and analytics load after the visitor's first interaction. That last choice is a trade-off: visitors who leave without scrolling or tapping are not recorded. It is a business decision, and your agency should explain it to you rather than make it silently.
Performance is a design decision
Most speed problems are decided long before anyone runs a test: a full-screen slider in the hero, four font families, a chat widget, a cookie banner that pushes the content down, a theme that loads every feature on every page. Fixing them after launch costs more, because they are built into the theme and plugins. Ask for performance targets in the same document that describes the design.
What this looks like in WordPress
- Images: WordPress creates several sizes of every upload and serves them with srcset, but it cannot fix a 5000-pixel photo that is displayed at 800 pixels everywhere. Upload images at a sensible size and use modern formats such as WebP, which WordPress supports.
- The main image: WordPress lazy-loads images natively, which is right for images further down the page but wrong for the hero. Recent versions also mark the likely LCP image with a high fetch priority; check that your theme or a plugin does not undo either of these.
- Plugins: many plugins add CSS and JavaScript to every page, even where they are not used. The "Reduce unused JavaScript" and "Reduce unused CSS" items in the report usually point straight at them.
- Responsiveness (INP): heavy page builders, chat widgets and consent scripts compete for the phone's processor. On WooCommerce shops, check whether cart and tracking scripts run on pages that do not need them.
- Layout shift (CLS): keep width and height on images, reserve space for embeds and banners, and avoid inserting notices above content that is already visible.
- Caching and hosting: page caching and decent hosting shorten the time before anything can appear. No front-end optimisation can fully hide a slow server.
A checklist for working with your agency
- Ask for mobile PageSpeed Insights results from two or three recent projects, and whether those sites have field data.
- Agree on targets in writing: Core Web Vitals in the "good" range, and a lab Performance score of 90+ on key templates, not only the homepage.
- Test the staging site on mobile before launch, in PageSpeed Insights and on a real mid-range phone.
- List every third-party script and decide together which ones are essential and which can load later.
- Check that the hero image is not lazy-loaded and that all images have dimensions.
- Limit fonts to the families and weights the design actually uses.
- Ask for a reason behind every plugin.
- After launch, follow the Core Web Vitals report in Google Search Console once enough data is available.
What a good result will and will not do
Google confirms that "Core Web Vitals are used by our ranking systems," but it also states that "Google Search always seeks to show the most relevant content, even if the page experience is sub-par." A fast website does not replace useful content and will not guarantee a position in the results. What it does is remove a reason for visitors to leave and make the site easier to use on the phones people actually carry.
If you would like to know where your current website stands, we can run a performance audit for you: lab tests on your most important pages, field data where it exists, and a list of fixes ordered by effort and impact. Get in touch and we will start with your homepage.
Sources
- About PageSpeed Insights (Google for Developers)
- Web Vitals (web.dev)
- Lighthouse performance scoring (Chrome for Developers)
- Understanding page experience in Google Search results (Google Search Central)
- Mobile-first indexing best practices (Google Search Central)